Analysis Execution
One of the primary functions of the Node UI is to allow admins to control the analyzes running on their node. This page describes the different features in the Node UI for managing and interacting with the analysis containers.
To see the statuses of the approved analyzes for your node, click the "Analyses" button in the menu bar at the top of the Node UI after logging in.
Table Overview
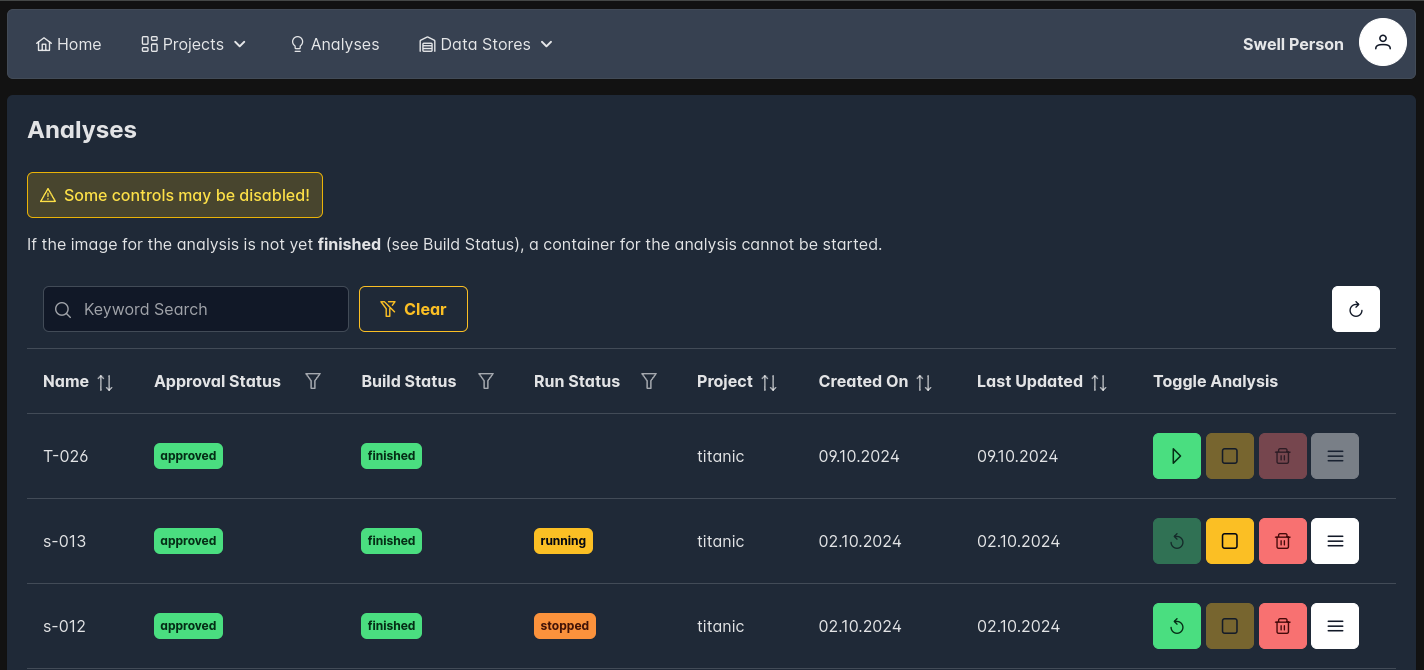
The analysis table provides an overview of all the approved analyzes on your node as well as displays their current states in the "Run Status" column. The columns of the table have various options for sorting the entries including being able to filter by certain categorical variables in addition to ordering by name or date.
Detailed Dates
Hovering your mouse cursor over a date will show the exact date and time
The search bar above the table allows the admin to quickly search for specific analyzes using keywords or identifiers. Additionally, to get the latest entries without refreshing the whole page, simply click the white "refresh" button above the table on the right side of the page.
Controlling an Analysis Run
Managing an analysis run can be done using the buttons in the last column of the table. Before an analysis can be started, a data store needs to be created for the associated project. See Managing Data Stores for more information on how to do this.
Starting an Analysis Run
The green play button is used to start an analysis. This button will only be enabled if the image for the analysis was configured and built as explained in Analysis. The administrator can see the status of the image compilation in the "Build Status" column of the analysis. By pressing the start button, the admin will create a new container on their node, pull the analysis image, and begin the run.
Analysis Data Access
As long as a data store was created for the analysis's project, by pressing the "Start" button, the node software will automatically configure everything in the backend to enable the container to access the requested data.
Stopping an Analysis Run
During an analysis run, a node admin may want to halt an analysis container manually. Once an analysis is started, the yellow stop button will be enabled and can be used to prematurely stop the container. After stopping the run, the green play button will change to indicate that the admin can rerun the analysis if they choose.
Analyzes that have run to completion will enter this "stopped" state by default.
Deleting an Analysis Run
In order to permanently remove the analysis container from the node cluster, the admin can click on the red delete button when it becomes activated after starting the analysis. This action also deletes the data access configuration for the individual analysis.
Viewing the Analysis Logs
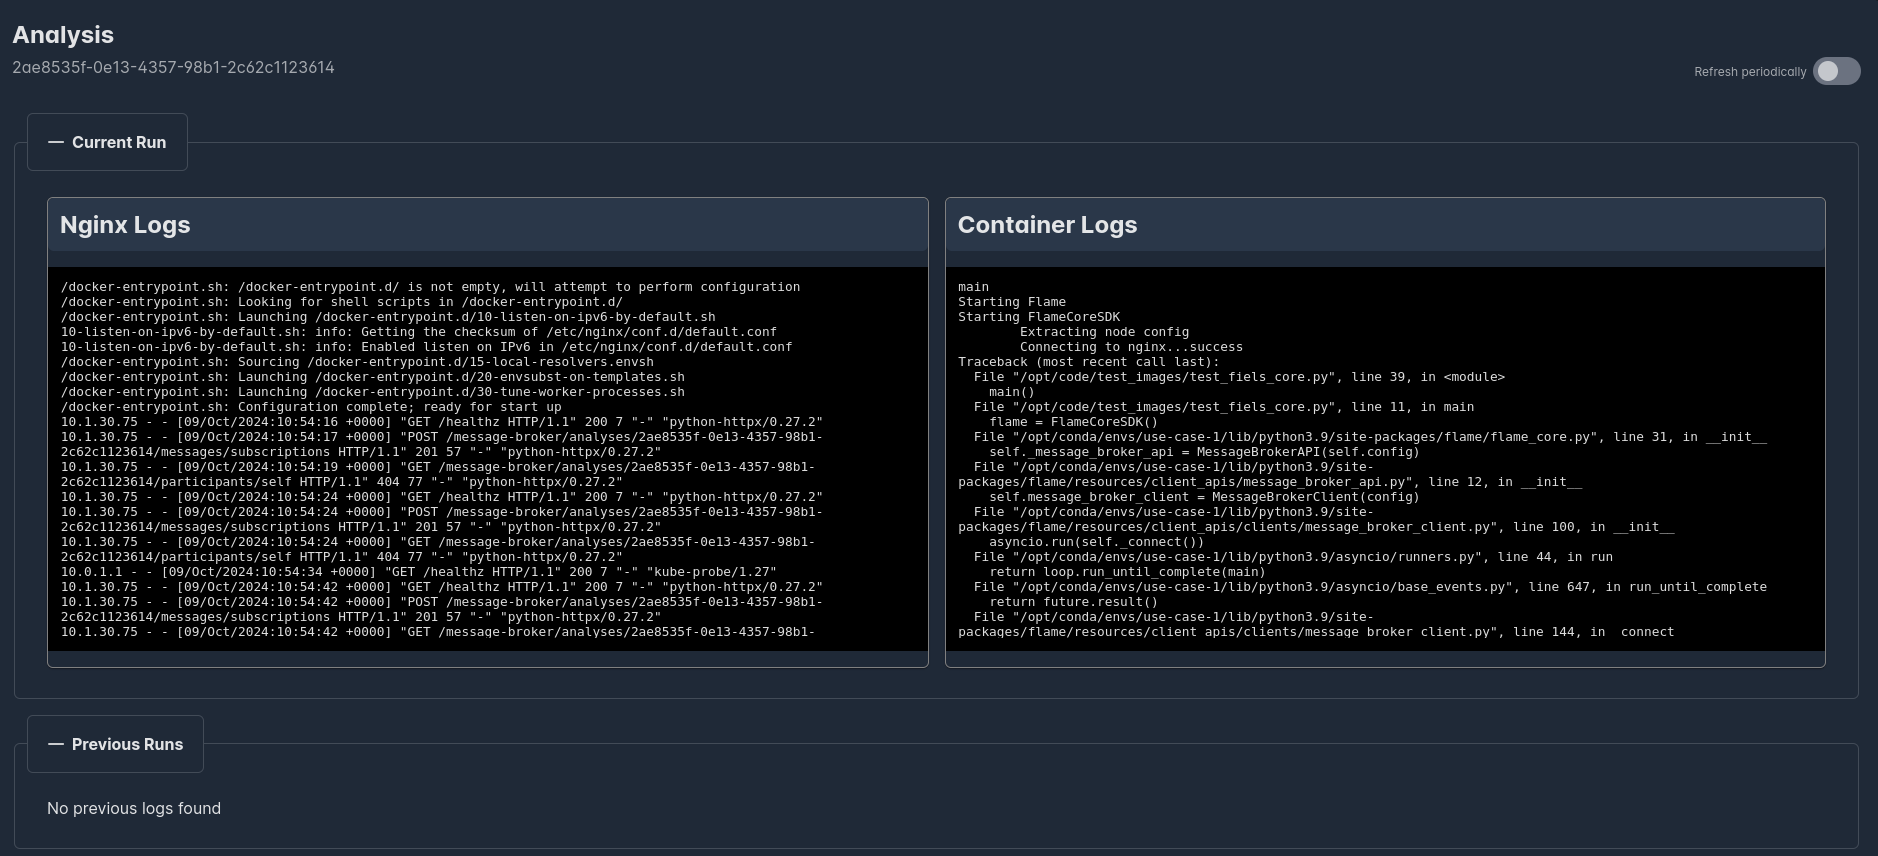
Once an analysis is started, administrators can view the logs for the associated containers. By default, two containers are created for each analysis: one container running the analysis image itself and a nginx container used for sending canned messages to the message broker service to let other nodes know about the current status. When the admin clicks on the white logs button, a new tab will open showing the logs for both of these containers.
The logs on this page are retrieved directly from the containers, and if the administrator wishes to stream the logs, they can press the "Refresh periodically" toggle in the top right of the page in order to refresh the logs every 5 seconds.
Past Runs
If the analysis was run prior or restarted, logs from the previously created containers will be available at the bottom of this page.

